Available Reports in SAS Flex
A variety of usage statistics are available in your secure web portal. Checking these reports can help you sort through calls, find out how many minutes you've used, view your peak call hours, and more. Please note that data over 2 years old is purged from Reports.
For instructions on how to view Reports in the SAS Flex mobile app, check out this article.
In this tutorial, you'll learn about:
Before we begin, you'll need to know how to access Reports. Within your SAS Flex portal, click the Reports icon on the left navigation panel. This will bring you to the Reports Dashboard.

What's on the Dashboard?
The default reports view will show you the Dashboard. To view additional reports, click on the corresponding link in menu at the top of the screen.

If at any time you wish to print your reports, click Print this page on the right-hand side of your screen.
Outcomes and Tags
At the top of the Dashboard, you will see two circle graphs: Outcome on the left, and Tag on the right. Hover over any part of the graphs for call statistics.

Use the Numbers dropdown to display the graphs by SAS number, and click the Date Filter to adjust your date range.


Last 3 Months Usage
Below the circle graphs, you'll find a table that will Compare usage from last 3 months, along with a line graph displaying an illustration of the same.

Hover over any point on the line graph to show you usage details by date.

Call Traffic Report
The Call traffic report tab will display Calls by Hour, Calls by Weekday, and Calls by Number. Modify the bar graph by selecting a specific Number and adjusting your date range.


Usage Report
The Usage report tab will display Average Length of Call, Usage by Date, and Usage by Outcome
Average Length of Call
Modify the graph by selecting a specific Number and Date Range from the top of the page.

Usage by Date
Additionally, you will see a Time Report which shows the Number of Calls and Number of Minutes on the Peak Days from the date range you selected. You will also see the % change to the right of the Number of Calls and Number of Minutes columns.

Usage by Outcome
Based off the Number and Date Range you've selected at the top of the page, this table will you should the Number of Calls, Number of Minutes, and Average Time of Call for each individual Outcome within the specified script.

Segmentation
A Segment report will show you the duration of calls, in seconds. By default the report will show data from the last 7 days but you can use the date filter accordingly.

Adjusting the Graph
To adjust the data for previous weeks, use the dropdown at the top of your page.
If you have multiple scripts, or numbers, you can also filter the data by selecting the script from the Numbers dropdown.
Segmented Usage by Hour
Under this section you will see a graph that details Segmented usage by hour for the period you selected. Click on any data point to show you the total usage in minutes for a specific hour.

Data distributed by Collector
At the bottom of the page, you will see a graph that details data distribution by Collector. On the right-hand side, choose the collector you'd like to view data for. In our example, we chose the First Name collector. Note that if you choose a collector that is not being used in your script, no data will populate.

General Reports
The General Reports tab will give you a basic overview of your call volume broken down by calls and/or minutes within any given date range. Use the Number dropdown to view:
- Minutes: This option will show you all minutes used among your SAS numbers within the date range you've selected.
- All Numbers: This option will show you all of the calls among your SAS numbers within the date range you've selected.
- Calls per Number: This option will show you all of the calls per specific number within the date range you've selected.


On-Call
The On-Call tab will show you several on-call related reports and graphs including Number of Incidents, Number of Notification Attempts, Summary Metrics by Number, and more. This data will only be visible to those who have enabled our premium on-call add-on.

Hold Data
The Hold Data report will provide insight into any queue times on your SAS line. This data will only be visible to those who have enabled our premium live call add-on feature.

Export Reports
With our Export report, you can download a report that contains the complete details that are gathered on each call. Export reports can be pulled for one month at a time. If you would like information for multiple months, the data will need to be requested individually.
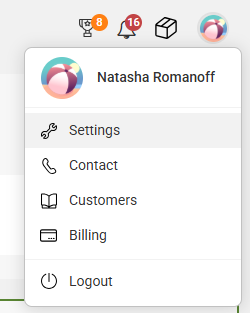
1. Go to your User icon in the upper right-hand corner and click Settings.
2. On the main Settings page, click Reports.

3. Select your desired Month and Year from the dropdown. Then click Export report. The .csv file will download automatically to your computer once it's done generating.

Keep in mind that timestamps in the exported data are shown in UTC time. You'll find instructions on converting the information to your own time zone here.